


TRINITY OSCILLATOR
TRINITY OSCILLATOR
TRINITY OSCILLATOR

Il Segreto?
La Matrice...
Un indicatore cosa deve fare?
DEVE INDICARE!
Il concetto è abbastanza logico e banale ma purtroppo continui a perderti tra mille indicatori (molti di questi pure in ritardo grafico), senza capire che il tuo focus deve essere l'operatività!
Il Trinity Oscillator non ha mille impostazioni...
Fa tutto da solo tu devi soltanto dirgli che mercato stai analizzando.
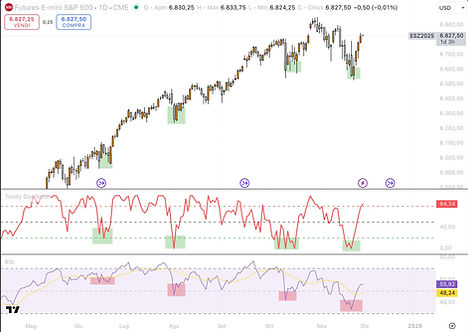
Grazie alla matrice dinamica non abbiamo una zona di iper-comprato ed iper-venduto statica...
Ma abbiamo un rapporto con la matrice dinamica che ci consente di ottenere un'affidabilità di oltre il 78%.
Quando finisce il ritracciamento?
Quando inizia il trend?
Tutte domande a cui il Trinity Oscillator fornisce una risposta chiara e diretta!

What is the Trinity Oscillator?

Perché non potrai più farne a meno...
La Svolta Decisiva...
Con l'introduzione della matrice dinamica il Trinity Oscillator si posiziona al primo posto come indicatore di iper-comprato / Iper-venduto su Trading View.
Non ha concorrenti, non ha compromessi...
È un indicatore che richiamando la matrice ti indica quando entrare a mercato e quando no!
Fornisce un quadro chiaro della situazione a colpo d'occhio e cancella completamente quella sensazione di insicurezza prima di entrare a mercato.
Dimentica tutti gli indicatori in ritardo e gli indicatori statistici...
Questo è qualcosa che non hai mai provato!
Il Trinity Oscillator è l'intelligenza artificiale degli ultimi tempi!
Ovvero, quel tassello mancante che ti permetterà di cestinare tutti gli altri indicatori che hai a grafico e ti consentirà di tenere il focus solo su una cosa...
La tua OPERATIVITA'!
Trinity COT Matrix
The COT report, published weekly by the CFTC, provides an overview of the trading positions of major market participants. Analyzing this report helps traders understand market dynamics, identifying potential trend reversals and strategic entry or exit points. With the Trinity COT Matrix, you'll have a unique visualization, as we've developed an indicator that allows you to visualize traders' positions at a glance, from an overvalued to an overvalued perspective.
How much does the Trinity Oscillator cost?
The Trinity Oscillator uses a contextualized and dynamic approach.
Based on a unique concept, it mathematically compares the movement of the graphical asset with a matrix representative of the reference market.
This comparison allows you to accurately identify the levels of
overvaluation and overdevaluation , providing key levels at which points the market is likely to make a significant high or low and thus the start of a new trend.
€199.00

How to buy the Trinity Oscillator
Fill out the form
Click the button
"Go to payment"
Make your payment
following the directions
Wait for activation
on Trading View
Your indicator will be active within 48 hours of receiving payment!
You don't have to do anything!
You will find it on your Tradingview profile "Invited Indicators".
Buy Trinity Oscillator Now
Bring home the result!
Buy Trinity Hub 's first proprietary indicator now and attach it directly to your Trading View.
Buy Trinity Oscillator Now
The Trinity Oscillator is an analytical tool designed to support trading decisions. It does not constitute financial advice or a guarantee of earnings. Use of the indicator involves risk and is at the user's sole discretion and responsibility. Read the Terms and Conditions for full details.